Irish Behavioural Science and Policy Network Event on Behavioural Economics and Healthcare in Ireland
Our next session takes place on March 8th in the Economics and Social Research Institute seminar room. It will address the application of behavioural economics and behavioural science more generally in healthcare in Ireland. The event will take place from 12pm to 2pm. It will consist of short opening contributions from four people actively involved in this area followed by a moderated panel discussion, and we will also include time for networking and discussion of potential collaborations. Currently confirmed panels are Dr. Fiona Kiernan from Beaumont Hospital who has been working on behavioural interventions in the area of sepsis, Kirsten Connelly Deputy Director of Communications at HSE, Robert Murphy Senior Researcher at the Department of Health who has been working on the interaction between the health system and patients in a range of contexts, and Dr. Pete Lunn who is the lead researcher in the ESRI Behavioural Economics program. To attend the event, please sign up here. The event is free but registration is required for planning purposes.
Stock Gyrations
Is this 1929, the beginning of the end? Or 2007? Is it 1974, annus horribilis in which the stock market drifted down 40% having something to do with stagflation, and did not recover until the 1980s? Is it 1987, a quick dip followed by recovery in a year? Or just an extended version of the flash crash, when the market went down 10% in a few hours, and bounced back by the end of the day? Are we in a "bubble" that's about to burst? How much does this have to do with the Fed? Of course I don't know the answer, but we can think through the logical possibilities.
(Note: This post has equations, graphs and quotes that tend to get mangled when it gets picked up. If it's mangled, come back to the original here.)
Why do prices fall?
Stock prices fall when there is bad news about future profits, or when the discount rate rises.
The discount rate is the rate investors require, looking forward, to get them to buy stocks. If people require a better rate of return, with no change in their expected cashflows, prices drop.
 Stop and think about that a second, as it's counterintuitive. Yes, the only way to get a better return out of the same profits or dividends is for today's price to drop.
Another way to think about it: Suppose all of a sudden there are good profitable opportunities for your money -- bond interest rates rise, or it's a good time to take money out of markets and invest in your company. Well, people will try to move money to those alternatives. But the stock market is a hot potato; someone has to hold the stocks. So stock prices must decline until the rate of return going forward matches the other attractions on a risk-adjusted basis. Good news about returns going forward is bad news about a downward jump in stock prices.
Bad news about cashflows is, well, bad news. The dashed line shifts down. Your stocks are not going to pay off as well as before. Higher required returns are neutral, really, for long-term investors. The price drops today, but the higher returns mean the price will slowly recover, just as long-term government bonds do.
So is this a moment of bad cashflow news or higher discount rate? Most commentary suggests it's not bad news about cashflows. The economy seems finally to be growing, and there isn't anything like a brewing subprime or other problem, as there was in 2007. Maybe we don't know about it, but one certainly doesn't read about it.
So let's think about discount rates. Why might investors require a higher return on stocks? Is it interest rates, a risk premium, and is the Fed behind it all?
Where are we?
Are we in a "bubble'' that is about to pop? Let's start by reviewing some facts. Here is the cumulative return on the NYSE since 1990. (This is the CRSP NYSE. Sadly the data stops 12/31/2017 so I don't show the recent drop. The larger index including NASDAQ shows a larger rise and fall in the tech boom and bust, but is otherwise about the same.)
This graph does not show anything terribly unusual about the recent period. Stocks drift up during expansions, and take a beating in recessions. There are also little blips like the Krugman election panic of November 2016. (Sorry, I couldn't resist.) Why have stocks gone up so much? Well, mostly because the expansion has gone on so long. The recent period is also notable in that the little wiggles are much smaller -- less volatility. That ended last week too.
Update: Thanks to Torsten Slok at DB the last year follows. His point, it's sharp but not all that big.

Next, look at the price-dividend ratio. (For a variety of reasons this is a better valuation measure than the commonly used price earnings ratio. This (CRSP) measure of dividends includes all cash payment to shareholders. No, repurchases don't cause a problem.)
You can see prices were high relative to dividends in the booming 1960s; they really rose in the late 1990s before the big 2000 bust. Then you see the 2008 crisis and recovery, and more recent wiggles. You can see prices fall in recessions, even relative to dividends which also fall in recessions.
Where is the booming stock market? Stock prices relative to dividends have not grown at all since the end of the recession. Well, evidently, dividends have been rising just as fast as prices in the current expansion -- which again weren't rising all that fast anyway. So the main reason stock prices are high is that dividends are high, and people expect that slow growth to continue.
So here we were before the recent drop. Are prices too high? Well, not as much as in 1999 for sure! But P/D is a lot higher than historical norms. Is this the beginning of a drop back to historic levels like 30, or even 20? Or is this a new normal? There is way too much commentary lately that whatever we remember from 20 years ago was "normal" and that things have to go back to that. Not without a reason.
Interest rates and stock prices
To think about this question we need some basics of what determines price-dividend ratios. Over long time periods, the return you get on stocks is the dividend yield -- how many dividends they pay per dollar invested plus the growth in dividends. Over short time periods you also get price appreciation per dividend, but over long time periods, the ratio of price to dividends comes back and price growth is the same as dividend growth. In sum,
So, looked at either as D/P or P/D, we now have the tools to think about what pushes stock prices around.
(There is nothing inherently ``rational'' or ``efficient markets'' about this. Behavioral finance just says the expectations are wrong, for example that people think \(g\) is big when in fact \(r\) is small.)
Stock prices are very sensitive to real interest rates, risk premiums, and growth expectations. At our current P/D of 40, for example, this means \(r-g=1/40=0.025\) or 2.5%. Just half a percent change in expected return or growth rate, \(r-g=0.02\) would mean \(P/D=1/0.02=50\), a 25% rise in stock prices. Conversely, a half percent rise in real interest rates would mean \(r-g=0.03\), a decline to \(P/D=33\) a 16.7% fall. No wonder stocks are (usually) volatile!
Now, to what's going on? If we take growth rate expectations off the table, then stock prices are moving because of changes in interest rates. And small interest rate changes do indeed imply big stock valuation changes -- though, again, take heart because it means the rate of return is higher, as in the first picture.
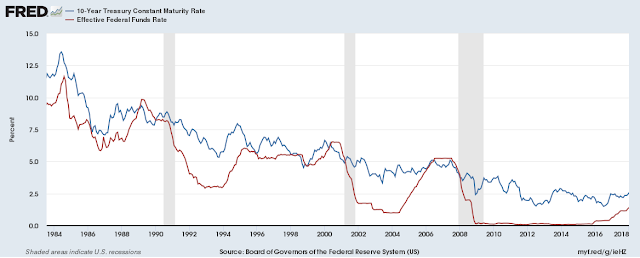
Does this relationship hold historically? Here is the D/P ratio (P/D upside down) and a measure of long-term real interest rates.
(The problem with 10 year real rates is knowing what 10 year expected inflation is, given that we did not have TIPS. There are lots of other problems too, such as unwinding the liquidity premium in government bonds. Here I used the Cleveland Fed's real rate model, which is in part based on survey expectations. I added the 10 year TIPS yield where we have it to confirm the general pattern of the Cleveland Fed's calculation.)
This is a remarkable graph: The entire rise in valuations from 1980 to 2008 corresponds exactly to the decline in real interest rates.
By this measure, the decline in real rates was huge, from 7% to essentially 0%. Plug that in to \(P/D=1/(r-g)\) and we're done. Stock prices are exactly where they should be.
In fact, by this measure, stock prices are too low. In 2008, real rates kept right on trundling down another two percentage points, but the dividend yield stabilized.
Well, I was careful to say "corresponds to" not "caused by" for a reason. The risk premium and growth expectations changed as well. Arguably the move to a low-growth economy starting in 2000, cutting one to two percentage points off \(g\), offset the decline in real rate. Or perhaps the risk premium isn't as low as we think it is. This isn't just waffling -- the relationship is basically an identity. One of those options must be true. If the dividend yield is 2.5%, and the real interest rate is 0%, then \(r^e-g\) is 2.5%, and has grown since 2000. Either the risk premium has grown 2.5% -- so much for the ``low risk premium'' -- or growth expectations have fallen 2.5%. Or the long-term real rate is profoundly mismeasured here.
More on all this in a minute. But the graph reminds us 1) Real rates have come down a lot, and 2) persistent changes in real rates really are an important part of stock market valuations. Oh, and they have nothing to do with ``risk appetite'' and all that other blather. Stocks are valued like bonds plus risk. We are noticing here that the bond-like component got much more valuable. That alone, not the risk component or the growth component, accounts for two decades of huge price rises.
This actually updates significantly some of my own work, and the asset pricing consensus. The great question why do price-dividend ratios vary so much occupied us a lot in the late 1980s and early 1990s, including myself, John Campbell, Bob Shiller, Gene Fama and Ken French. The rough answer we came to -- pretty much all variation in D/P or P/D comes down to variation in risk premiums, the \(r^e=r-r^l\) term. The underlying fact is that times of high P/D are not reliably followed by higher dividend growth (Shiller), and they are reliably followed by low excess returns (Fama and French). If you add it up, the risk premium effect neatly accounts for all the variation in P/D (Campbell and Shiller, me).
Well, in the data up to 1990, we didn't see much persistent variation in real rates of interest, and what we did see was not correlated well with stock prices. Well, that was 1990, and now is now. This graph suggests that in fact a lot of the recent variation in P/D corresponds to lower real interest rates. Also, it's the low frequency, decade to decade movement in P/D that is not well accounted for by any models. An academic version of this observation needs to be written.
Practical bottom line: The stories that the recent stock price decline comes from rising long-term real interest rates make sense. They might be wrong, but they make sense. That's saying a lot more than most of the other stories being bandied around right now.
Interest rates, growth, stock prices, and the Fed.
The story is not that easy however. We have to think about real interest rates \(r\) and growth \(g\) together. And there is this puzzle to answer -- how can it be that good news about the economy sends the market down? If \(P/D=1/(r-g)\) more \(g\) should raise \(P\), no? It should shift up the dashed line in my first graph?
No. We have to think about where real interest rates come from. One of the most basic relationships in economics is that higher growth means higher real interest rates. If everyone will be richer in the future -- growth -- they need an incentive to save and not blow it all today. And growth means a higher marginal product of capital, and hence higher interest rates. As a simple equation, \[ \text{real rate} = \gamma g \]where \(\gamma\) is a parameter, usually between about 1/2 and 2, and get ready for a bar fight at the AEA convention over just what value to use. 1% higher growth means about a half percent to two percent higher real interest rate.
(There is a second term too, important in understanding things like the financial crisis. More uncertainty means lower interest rates. Not today.)
If \(\gamma=1\), if one percent growth means one percent higher real interest rates, then higher growth has no effect at all on stock prices or price dividend ratios. (\(D/P = r^l + r^e - g.\) Raise \(r^l\) and \(g\) by the same amount.) If, as I think is more likely right in this case, \(\gamma>1\), then higher growth lowers stock prices. Yes. Higher growth means a higher discount rate as well as more dividends. The discount rate effect can overwhelm the cashflow effect.
This has nothing to do with the Fed. There is a natural human tendency to look for Agency, for some man or woman behind the curtain pulling all the strings, and these days that means the Fed. For example, the WSJ Editorial on stocks:
Yes, the papers like to say that higher growth will induce the Fed to raise rates. The Fed can put a finger in this dike for a bit if they want to, but even the Fed cannot long fight the positive or negative relationship between real growth and real interest rates.
So it makes perfect sense, at least as a logical possibility, that more growth lowers stock prices! Again, this is like my lower line in the first picture -- and actually a bit better because we also raise the terminal point. If this is what happened, well, regret that you didn't see it happening and stay out during the dip, but be reassured the market will make it back.
Risk premiums
What about the ``unusually low risk premium''? Aren't the Fed's ``massive QE and abnormally low interest rates distorting risk premiums and causing asset price bubbles?'' (The best definition of ``bubble'' I can muster is a risk premium that is too low, distorted somehow.)
Here is the contrary view. We are at the late summer of the business cycle. The economy is relatively healthy, at least if you're a stock market investor. (Many of these own companies.) Economic volatility is still at an all time low. Bonds are still giving pretty atrocious real returns. Yeah, stocks look pretty healthily priced -- as you contemplate your \(P/D = 1/(r^l + r^e - g)\) it looks like the extra return from stocks \(r^e\) is pretty low. But what else are you going to do with the money? You can afford a little risk. Contrariwise, the same investors in the bottom of the great recession, with very low \( P/D\) signaling a high risk premium \(r^e\), said to themselves or their brokers, yes, this is a buying opportunity, stocks will likely bounce back. But my business is in danger of closing, my house might get foreclosed, I just can't take any risk right now.
In short, it is perfectly rational for investors to be more risk-averse, and demand a higher risk premium \(r^e\) in the bottom of recessions, and to hold stocks despite a low risk premium in quiet good times like right now. And this has nothing to do with the Fed, QE, or anything else.
John Campbell and I wrote a simple model of this phenomenon a long time ago, and I've reviewed it several times since, most recently here. Sorry for flogging the same ideas, but this possibility still hasn't made it to, say, the Fed-obsessed WSJ editorial pages, to say nothing of the Trump-obsessed pages at other outlets.
John and I tied risk aversion to consumption trends. If consumption is high relative to the recent past, in good times, you more willing to hold risk. If consumption is declining relative to the recent past, you get more scared. Lots of other mechanisms, including debt, work much the same way. If you don't like the precise model, consumption relative to recent past is a good general business cycle indicator.
Let's look historically. Here is consumption less a moving average (I used \(x_t = \sum_{j=0}^\infty 0.9^j c_{t-j})\), plotted with the log of the price/dividend ratio. The two series have different scales. The point is to see the correlation.
The pattern is longstanding. In good times, when consumption rises relative to recent past, stock valuations go up. In bad times, such as the great recession, consumption falls and so do stock valuations. People are scared. The same pattern happens regularly in the past.
The two lines drift apart, but as we saw above real interest rates account for that. Then the business-cycle related risk premium here accounts for the rises and dips.
And, if I may belabor the point, there was no QE, zero interest rates, and so forth going on in all these past instances when we see exactly the same pattern. Higher real interest rates are a regular, simple, utterly normal part of expansions, and lower risk premiums are a regular, simple, utterly normal part of expansions.
I was interested to read Tyler Cowen at Bloomberg back in to this view, based entirely on intuition:
This view should not necessarily make you sleep at night however. It means that a downturn will be accompanied by higher risk aversion again, and not only will dividends fall, prices will fall further. Moreover, historically, asset price falls have been preceded by periods of higher volatility. Alas, many periods of higher volatility have just faded away, so it's a warning sign not a signal. Sure, this mechanism means they will bounce back, but if you are clairvoyant enough to see it coming it will be better to avoid the fall! If not, well, be read to buy when everyone else is scared -- if you are one of the lucky few who can afford not to be scared.
The VIX, volatility, technical factors
There is another kind of ``discount factor variation,'' including 1987 and the flash crash. Sometimes the machinery of markets gets in the way, and prices fall more than they should. They quickly bounce back. If you can buy at the bottom you can make a fortune, but the prices fell precisely because it's hard to buy.
There were scattered report on Monday of hours long delays for retail customers to trade. (Can't find link.) But I do not get a sense this was a big clog in the markets. I would be curious to hear from people closer to markets.
The bigger news is the return of volatility -- big daily changes. To put this in historical perspective, here are two plots


The surprise, really, is just how low low volatility had become. Historically the stock market index has had a volatility around 15-20% per year -- a typical year saw a 15-20% change, and a typical day saw a \(15-20 / \sqrt{250} \approx \) one percent change. But, as you see in the top graph, volatility also declines in the late summer of the business cycle. Volatility has many occasional little eruptions, typically around price drops, and then washes away. Except when volatility rises in advance of the next recession and market decline. Which is this? I wish I knew.
Volatility is not about "fear" nor is it about "uncertainty." Volatility occurs when options change quickly. Constant bad news or good news just leads to constantly low or high prices. This is a sign of a time when either a lot of real information is hitting the market, or a lot of people are trying to process what's going on ahead of everyone else.
The "VIX bust" is hot in the news. A lot of people bet that the graph you saw above would not rise. To be ``short volatility'' means basically that you write insurance to people who worry about markets going down, (volatility is a big part of the value of put options) and you write insurance to people who are worried about events like right now in which markets start to move a lot. Hello, when you write insurance, occasionally you have to pay up.
As the graphs make clear, writing volatility insurance, or betting that volatility will continue to go down, is like writing earthquake insurance. Not much happens for many years in a row, and you can post nice profits. Then it jumps and you lose big time. Anyone who did this based just on historical returns is now crying the tears of the greedy neophyte. But they have lots of company. Back in the 1990s, Long Term Capital Management went under, basically for betting that similar looking graphs would continue to go down.
Well, if after all these years people are at it, P.T. Barnum had a good word for them. But did this have something to do with the stock market crash? How Bets Against Volatility Fed the Stock Market Rout in WSJ is an example of this train of thought.
On first glance, sure, a lot of people lost a ton of money, and then sold out other risky positions. But Econ 101: for every buyer there is a seller. Derivatives contracts are pure cases of this fact -- the net supply really is zero, for everybody who lost a dollar shorting VIX somebody else made a dollar buying it.
To get a story like this to go you need all sorts of market discombobulations. Somehow the people who lost money must be more important to markets than the people who made money. This can happen -- if a bunch of traders in a complex obscure security all lose money, and all try to sell, there is nobody to buy. But I don't really see that case here, and stocks are not a complex obscure security.
A trader friend also tells me that he has seen lots of people stop hedging -- so sure low volatility would continue that they don't cover the downside. He said many have lost a ton, and now are frantically selling to cover their positions. Such price pressure can have short run impacts, but does not last long.
Inflation and real interest rates
So we're back at hints of higher long-term real interest rates as the main likely culprit behind this week's decline and gyrations.
Here too most of the stories don't make much sense. Inflation per se should not make much difference. If expected inflation rises, interest rates rise, but real interest rates are unaffected. Inflation may make the Fed act more quickly, but there is not much correlation between what the Fed does with short term rates and the behavior of 10 year or more rates that matter to the stock market -- or to corporate investment.
Yes, there is some correlation -- especially at the end of expansions, short and long rates rise together. But the correlation is a whole lot less than the usual Wizard of Oz behind the curtain stories. And even the Fed cannot move real rates for very long. There is a good chicken-and-egg question whether the Fed can hold short rates down for long when long rates want to rise. The Fed pretty much has to jump in front of the parade and pretend to lead it.
Inflation does seem finally to be rising. The fact that higher rates are associated with the dollar falling suggests that a lot of the higher rates are due to inflation, and TIPs have not moved (top graph.)
So, the question before us is, are long-term real rates finally rising -- back to something like the historical norm that held for centuries, and if so why?
The good story is that we are entering a period of higher growth. Depending on your partisan tastes, point to tax cuts and deregulation, or state that Obama medicine is finally kicking in. This would raise real growth, with \(\gamma>1\) lead to a small stock price decline, but higher stock returns and bond returns going forward.
There is a bad story too. Having passed a tax cut that left untouched will lead to trillion-dollar deficits, Congressional leaders just agreed to $300 billion more spending. The Ryan plan that tax cuts would be followed by entitlement reform may be evaporating. Publicly held debt is $20 trillion. At some point bond markets say no, and real rates go up because the risk premium goes up. The US is in danger that higher interest rates mean higher interest costs on that debt, which means higher deficits, which means higher interest rates. $20 trillion times 5% interest = $1 trillion in interest costs.
The former leads to some inflation if you believe in the Phillips curve. The latter leads to stagflation in a tight fiscal moment.
Which is it? I don't know, I'm an academic not a trader.
One consolation of the stock market decline: I hope we don't have to hear how all the corporate tax cut did was to boost the stock market!
Well, two days ago this was going to be a short post responding to the WSJ's view that the Fed is behind it all, and Tyler's nice intuition. It got a bit out of hand, but I hope it's still interesting.
****
Data Update (Geeks only).
P/D isn't really "better" than P/E or other measures. A measure is what it is, you have to specify a question before there is an answer. Ideally, we want a measure that isolates expected returns, and tells us if prices are higher or lower given the level of expected dividends. So ideally, we would account for expected future dividends and the result would be a pure measure of expected returns (rational or not). P/D works pretty well that way because dividends are not very forecastable. Price divided by this year's dividends turns out to be a decent approximation to price divided by anyone's forecast of future dividends. But not perfect. P/E is less good that way because earnings bat about a bit more than dividends. For individual companies you can't use P/D, because so many of them do not pay dividends. Following Fama and French, the ratio of market value to book value is better there, because book value is usually positive, or not so frequently zero.
I use the CRSP definitions. I start from the CRSP return with and without dividends and infer the dividend yield. ''Dividends" here includes not only cash dividends but all cash payments to shareholders. So, if your small company gets bought by Google, and the shareholders get cash, that is a "dividend" payout. I suspect this accounts for the difference noted by WC Varones below. As others point out, earnings has all sorts of measurement issues, and also does not control for leverage.
Dividends are very seasonal, so you can't divide price by this month's dividends or you get a lot of noise. I use the last year's worth of dividends, brought forward by reinvesting them. This introduces some "return" into the dividend series. If you just sum dividends, though, identities like \(R_{t+1} = (P_{t+1}+D_{t+1})/P_t \) no longer hold in your annual data.
x = load('crsp_nyse_new_2018.txt');
caldt = x(:,1);
totval = x(:,2);
usdval = x(:,3);
sprtrn = x(:,4);
spindx = x(:,5);
vwretd = x(:,6);
vwretx = x(:,7);
[yr,mo,day,crsp_date_number] = decode_date(caldt);
T = size(vwretd,1);
vwretda = (1+vwretd(1:T-11)).*(1+vwretd(2:T-10)).*(1+vwretd(3:T-9)).*...
(1+vwretd(4:T-8)).*(1+vwretd(5:T-7)).*(1+vwretd(6:T-6)).*...
(1+vwretd(7:T-5)).*(1+vwretd(8:T-4)).*(1+vwretd(9:T-3)).*...
(1+vwretd(10:T-2)).*(1+vwretd(11:T-1)).*(1+vwretd(12:T));
vwretxa = (1+vwretx(1:T-11)).*(1+vwretx(2:T-10)).*(1+vwretx(3:T-9)).*...
(1+vwretx(4:T-8)).*(1+vwretx(5:T-7)).*(1+vwretx(6:T-6)).*...
(1+vwretx(7:T-5)).*(1+vwretx(8:T-4)).*(1+vwretx(9:T-3)).*...
(1+vwretx(10:T-2)).*(1+vwretx(11:T-1)).*(1+vwretx(12:T));
vwdp = vwretda./vwretxa-1; %D_t+1/P_t+1 = [(P_t+1+D_t+1)/P_t] / [P_t+1/P_t] -1;
vwdda = vwdp(13:end)./vwdp(1:end-12).*vwretxa(13:end); % D_t+1/D_t = D_t+1/P_t+1 / D_t/P_t * P_t+1/P_t
vwdda = [ones(23,1)*NaN; vwdda];
cumval = cumprod(1+vwretd);
vwdp = [ ones(11,1)*NaN; vwdp]; % keep length of series the same
I get stock data from CRSP via WRDS. This is the NYSE only. I can't post the full data, as it belongs to CRSP. Here is an excerpt that will let you calculate the last year, and check that things are right if you download the whole thing.
%crsp_nyse_new_2018.txt
% caldt totval usdval sprtrn spindx vwretd vwretx
19260130 27624240.80 27412916.20 0.022472 12.74 0.000561 -0.001395
19260227 26752064.10 27600952.10 -0.043956 12.18 -0.033046 -0.036587
19260331 25083173.40 26683758.10 -0.059113 11.46 -0.064002 -0.070021
19260430 25886743.80 24899755.60 0.022688 11.72 0.037019 0.034031
...
20160129 17059005700.00 17976992500.00 -0.050735 1940.24 -0.050111 -0.051700
20160229 16986848800.00 17001893900.00 -0.004128 1932.23 0.005104 0.002251
20160331 18122913200.00 16951468600.00 0.065991 2059.74 0.072190 0.069562
20160429 18503144900.00 18082712100.00 0.002699 2065.30 0.023324 0.021716
20160531 18479138100.00 18410229900.00 0.015329 2096.96 0.006124 0.003392
20160630 18613173100.00 18422135300.00 0.000906 2098.86 0.011175 0.008957
20160729 19054705700.00 18557630600.00 0.035610 2173.60 0.028433 0.026872
20160831 18993464300.00 19049575300.00 -0.001219 2170.95 0.000196 -0.002532
20160930 18829544800.00 18880924600.00 -0.001234 2168.27 -0.003876 -0.005878
20161031 18404742600.00 18802632900.00 -0.019426 2126.15 -0.021331 -0.022944
20161130 19220882900.00 18383296300.00 0.034174 2198.81 0.048548 0.045701
20161230 19568491300.00 19178151000.00 0.018201 2238.83 0.021566 0.019486
20170131 19824534000.00 19526674900.00 0.017884 2278.87 0.014007 0.012623
20170228 20355248600.00 19781803200.00 0.037198 2363.64 0.031422 0.028905
20170331 20237616500.00 20334429600.00 -0.000389 2362.72 -0.003961 -0.006103
20170428 20286715000.00 20194157100.00 0.009091 2384.20 0.003950 0.002468
20170531 20299003900.00 20276905500.00 0.011576 2411.80 0.002199 -0.000507
20170630 20602218600.00 20256933000.00 0.004814 2423.41 0.018204 0.016235
20170731 20747539100.00 20488018000.00 0.019349 2470.30 0.015290 0.013394
20170831 20593088100.00 20742392900.00 0.000546 2471.65 -0.005133 -0.007874
20170929 21147810200.00 20381001300.00 0.019303 2519.36 0.030435 0.028662
20171031 21343546700.00 21130998500.00 0.022188 2575.26 0.011831 0.010360
20171130 21904734200.00 21302790800.00 0.028083 2647.58 0.030537 0.027670
20171229 22016063100.00 21683038400.00 0.009832 2673.61 0.015914 0.014117
(Note: This post has equations, graphs and quotes that tend to get mangled when it gets picked up. If it's mangled, come back to the original here.)
Why do prices fall?
Stock prices fall when there is bad news about future profits, or when the discount rate rises.
The discount rate is the rate investors require, looking forward, to get them to buy stocks. If people require a better rate of return, with no change in their expected cashflows, prices drop.

Another way to think about it: Suppose all of a sudden there are good profitable opportunities for your money -- bond interest rates rise, or it's a good time to take money out of markets and invest in your company. Well, people will try to move money to those alternatives. But the stock market is a hot potato; someone has to hold the stocks. So stock prices must decline until the rate of return going forward matches the other attractions on a risk-adjusted basis. Good news about returns going forward is bad news about a downward jump in stock prices.
Bad news about cashflows is, well, bad news. The dashed line shifts down. Your stocks are not going to pay off as well as before. Higher required returns are neutral, really, for long-term investors. The price drops today, but the higher returns mean the price will slowly recover, just as long-term government bonds do.
So is this a moment of bad cashflow news or higher discount rate? Most commentary suggests it's not bad news about cashflows. The economy seems finally to be growing, and there isn't anything like a brewing subprime or other problem, as there was in 2007. Maybe we don't know about it, but one certainly doesn't read about it.
So let's think about discount rates. Why might investors require a higher return on stocks? Is it interest rates, a risk premium, and is the Fed behind it all?
Where are we?
Are we in a "bubble'' that is about to pop? Let's start by reviewing some facts. Here is the cumulative return on the NYSE since 1990. (This is the CRSP NYSE. Sadly the data stops 12/31/2017 so I don't show the recent drop. The larger index including NASDAQ shows a larger rise and fall in the tech boom and bust, but is otherwise about the same.)
 |
| Cumulative return NYSE since 1990. Source CRSP |
Update: Thanks to Torsten Slok at DB the last year follows. His point, it's sharp but not all that big.

Next, look at the price-dividend ratio. (For a variety of reasons this is a better valuation measure than the commonly used price earnings ratio. This (CRSP) measure of dividends includes all cash payment to shareholders. No, repurchases don't cause a problem.)
 |
| Price / dividend ratio, NYSE. Source CRSP |
Where is the booming stock market? Stock prices relative to dividends have not grown at all since the end of the recession. Well, evidently, dividends have been rising just as fast as prices in the current expansion -- which again weren't rising all that fast anyway. So the main reason stock prices are high is that dividends are high, and people expect that slow growth to continue.
So here we were before the recent drop. Are prices too high? Well, not as much as in 1999 for sure! But P/D is a lot higher than historical norms. Is this the beginning of a drop back to historic levels like 30, or even 20? Or is this a new normal? There is way too much commentary lately that whatever we remember from 20 years ago was "normal" and that things have to go back to that. Not without a reason.
Interest rates and stock prices
To think about this question we need some basics of what determines price-dividend ratios. Over long time periods, the return you get on stocks is the dividend yield -- how many dividends they pay per dollar invested plus the growth in dividends. Over short time periods you also get price appreciation per dividend, but over long time periods, the ratio of price to dividends comes back and price growth is the same as dividend growth. In sum,
return = dividend yield + growth rate
\[ r = \frac{D}{P} + g \]This is also where price comes from. The price you're willing to pay depends on the expected return going forward, and expected dividend growth (Prices are high relative to current dividends if people expect a lot more dividends in the future.)\[ \frac{D}{P} = r - g = r^l + r^e - g \]\[ \frac{P}{D} =\frac{1}{r - g} =\frac{1}{ r^l + r^e - g} \] Here I broke apart the expected return into components. First, the expected return on stocks is equal to the long-term real risk-free rate \(r^l\) plus the risk premium \(r^e\). This is just a definition -- the risk premium is \(r^e=r-r^l\).So, looked at either as D/P or P/D, we now have the tools to think about what pushes stock prices around.
(There is nothing inherently ``rational'' or ``efficient markets'' about this. Behavioral finance just says the expectations are wrong, for example that people think \(g\) is big when in fact \(r\) is small.)
Stock prices are very sensitive to real interest rates, risk premiums, and growth expectations. At our current P/D of 40, for example, this means \(r-g=1/40=0.025\) or 2.5%. Just half a percent change in expected return or growth rate, \(r-g=0.02\) would mean \(P/D=1/0.02=50\), a 25% rise in stock prices. Conversely, a half percent rise in real interest rates would mean \(r-g=0.03\), a decline to \(P/D=33\) a 16.7% fall. No wonder stocks are (usually) volatile!
Now, to what's going on? If we take growth rate expectations off the table, then stock prices are moving because of changes in interest rates. And small interest rate changes do indeed imply big stock valuation changes -- though, again, take heart because it means the rate of return is higher, as in the first picture.
Does this relationship hold historically? Here is the D/P ratio (P/D upside down) and a measure of long-term real interest rates.
 |
| NYSE D/P, Cleveland Fed 10 Year real rate, and 10 year TIPS |
(The problem with 10 year real rates is knowing what 10 year expected inflation is, given that we did not have TIPS. There are lots of other problems too, such as unwinding the liquidity premium in government bonds. Here I used the Cleveland Fed's real rate model, which is in part based on survey expectations. I added the 10 year TIPS yield where we have it to confirm the general pattern of the Cleveland Fed's calculation.)
This is a remarkable graph: The entire rise in valuations from 1980 to 2008 corresponds exactly to the decline in real interest rates.
By this measure, the decline in real rates was huge, from 7% to essentially 0%. Plug that in to \(P/D=1/(r-g)\) and we're done. Stock prices are exactly where they should be.
In fact, by this measure, stock prices are too low. In 2008, real rates kept right on trundling down another two percentage points, but the dividend yield stabilized.
Well, I was careful to say "corresponds to" not "caused by" for a reason. The risk premium and growth expectations changed as well. Arguably the move to a low-growth economy starting in 2000, cutting one to two percentage points off \(g\), offset the decline in real rate. Or perhaps the risk premium isn't as low as we think it is. This isn't just waffling -- the relationship is basically an identity. One of those options must be true. If the dividend yield is 2.5%, and the real interest rate is 0%, then \(r^e-g\) is 2.5%, and has grown since 2000. Either the risk premium has grown 2.5% -- so much for the ``low risk premium'' -- or growth expectations have fallen 2.5%. Or the long-term real rate is profoundly mismeasured here.
More on all this in a minute. But the graph reminds us 1) Real rates have come down a lot, and 2) persistent changes in real rates really are an important part of stock market valuations. Oh, and they have nothing to do with ``risk appetite'' and all that other blather. Stocks are valued like bonds plus risk. We are noticing here that the bond-like component got much more valuable. That alone, not the risk component or the growth component, accounts for two decades of huge price rises.
This actually updates significantly some of my own work, and the asset pricing consensus. The great question why do price-dividend ratios vary so much occupied us a lot in the late 1980s and early 1990s, including myself, John Campbell, Bob Shiller, Gene Fama and Ken French. The rough answer we came to -- pretty much all variation in D/P or P/D comes down to variation in risk premiums, the \(r^e=r-r^l\) term. The underlying fact is that times of high P/D are not reliably followed by higher dividend growth (Shiller), and they are reliably followed by low excess returns (Fama and French). If you add it up, the risk premium effect neatly accounts for all the variation in P/D (Campbell and Shiller, me).
Well, in the data up to 1990, we didn't see much persistent variation in real rates of interest, and what we did see was not correlated well with stock prices. Well, that was 1990, and now is now. This graph suggests that in fact a lot of the recent variation in P/D corresponds to lower real interest rates. Also, it's the low frequency, decade to decade movement in P/D that is not well accounted for by any models. An academic version of this observation needs to be written.
Practical bottom line: The stories that the recent stock price decline comes from rising long-term real interest rates make sense. They might be wrong, but they make sense. That's saying a lot more than most of the other stories being bandied around right now.
Interest rates, growth, stock prices, and the Fed.
The story is not that easy however. We have to think about real interest rates \(r\) and growth \(g\) together. And there is this puzzle to answer -- how can it be that good news about the economy sends the market down? If \(P/D=1/(r-g)\) more \(g\) should raise \(P\), no? It should shift up the dashed line in my first graph?
No. We have to think about where real interest rates come from. One of the most basic relationships in economics is that higher growth means higher real interest rates. If everyone will be richer in the future -- growth -- they need an incentive to save and not blow it all today. And growth means a higher marginal product of capital, and hence higher interest rates. As a simple equation, \[ \text{real rate} = \gamma g \]where \(\gamma\) is a parameter, usually between about 1/2 and 2, and get ready for a bar fight at the AEA convention over just what value to use. 1% higher growth means about a half percent to two percent higher real interest rate.
(There is a second term too, important in understanding things like the financial crisis. More uncertainty means lower interest rates. Not today.)
If \(\gamma=1\), if one percent growth means one percent higher real interest rates, then higher growth has no effect at all on stock prices or price dividend ratios. (\(D/P = r^l + r^e - g.\) Raise \(r^l\) and \(g\) by the same amount.) If, as I think is more likely right in this case, \(\gamma>1\), then higher growth lowers stock prices. Yes. Higher growth means a higher discount rate as well as more dividends. The discount rate effect can overwhelm the cashflow effect.
This has nothing to do with the Fed. There is a natural human tendency to look for Agency, for some man or woman behind the curtain pulling all the strings, and these days that means the Fed. For example, the WSJ Editorial on stocks:
"The paradox of the equity-market correction is that it’s taking place even as the real economy looks stronger than it’s been since at least 2005 and maybe 1999. "
"So why are stocks falling amid all the good news? The best answer we’ve heard is that stocks are reflecting a return to volatility and risk after years of the Fed’s financial repression. With its quantitative easing bond purchases, the Fed has for a decade suppressed market price signals in bonds."
"Investors may finally be figuring out that the global quantitative-easing monetary party is ending."Look back at my graph. Real interest rates have been on a slow downward trend since 1980. That trend is unbroken since 2008. There is not a whiff that QE or anything else has budged that trend. (Lots of good graphs on this point in 8 heresies of monetary policy here. ) If the Fed has anything to do with it, it is the slow victory over inflation expectations, not QE and a lot of talk.
Yes, the papers like to say that higher growth will induce the Fed to raise rates. The Fed can put a finger in this dike for a bit if they want to, but even the Fed cannot long fight the positive or negative relationship between real growth and real interest rates.
So it makes perfect sense, at least as a logical possibility, that more growth lowers stock prices! Again, this is like my lower line in the first picture -- and actually a bit better because we also raise the terminal point. If this is what happened, well, regret that you didn't see it happening and stay out during the dip, but be reassured the market will make it back.
Risk premiums
What about the ``unusually low risk premium''? Aren't the Fed's ``massive QE and abnormally low interest rates distorting risk premiums and causing asset price bubbles?'' (The best definition of ``bubble'' I can muster is a risk premium that is too low, distorted somehow.)
Here is the contrary view. We are at the late summer of the business cycle. The economy is relatively healthy, at least if you're a stock market investor. (Many of these own companies.) Economic volatility is still at an all time low. Bonds are still giving pretty atrocious real returns. Yeah, stocks look pretty healthily priced -- as you contemplate your \(P/D = 1/(r^l + r^e - g)\) it looks like the extra return from stocks \(r^e\) is pretty low. But what else are you going to do with the money? You can afford a little risk. Contrariwise, the same investors in the bottom of the great recession, with very low \( P/D\) signaling a high risk premium \(r^e\), said to themselves or their brokers, yes, this is a buying opportunity, stocks will likely bounce back. But my business is in danger of closing, my house might get foreclosed, I just can't take any risk right now.
In short, it is perfectly rational for investors to be more risk-averse, and demand a higher risk premium \(r^e\) in the bottom of recessions, and to hold stocks despite a low risk premium in quiet good times like right now. And this has nothing to do with the Fed, QE, or anything else.
John Campbell and I wrote a simple model of this phenomenon a long time ago, and I've reviewed it several times since, most recently here. Sorry for flogging the same ideas, but this possibility still hasn't made it to, say, the Fed-obsessed WSJ editorial pages, to say nothing of the Trump-obsessed pages at other outlets.
John and I tied risk aversion to consumption trends. If consumption is high relative to the recent past, in good times, you more willing to hold risk. If consumption is declining relative to the recent past, you get more scared. Lots of other mechanisms, including debt, work much the same way. If you don't like the precise model, consumption relative to recent past is a good general business cycle indicator.
Let's look historically. Here is consumption less a moving average (I used \(x_t = \sum_{j=0}^\infty 0.9^j c_{t-j})\), plotted with the log of the price/dividend ratio. The two series have different scales. The point is to see the correlation.
 |
| Consumption minus a moving average, and log P/D on NYSE. |
The pattern is longstanding. In good times, when consumption rises relative to recent past, stock valuations go up. In bad times, such as the great recession, consumption falls and so do stock valuations. People are scared. The same pattern happens regularly in the past.
The two lines drift apart, but as we saw above real interest rates account for that. Then the business-cycle related risk premium here accounts for the rises and dips.
And, if I may belabor the point, there was no QE, zero interest rates, and so forth going on in all these past instances when we see exactly the same pattern. Higher real interest rates are a regular, simple, utterly normal part of expansions, and lower risk premiums are a regular, simple, utterly normal part of expansions.
I was interested to read Tyler Cowen at Bloomberg back in to this view, based entirely on intuition:
In a volatile and uncertain time politically, we have observed sky-high prices for blue-chip U.S. equities. Other asset prices also seem to be remarkably high: home values and rentals in many of the world’s top-tier cities, negative real rates and sometimes negative nominal rates on the safest government securities, and the formerly skyrocketing and still quite high price of Bitcoin and other crypto-assets.
Might all of those somewhat unusual asset prices be part of a common pattern? Consider that over the past few decades there has been a remarkable increase of wealth in the world, most of all in the emerging economies. Say you hold enough wealth to invest: What are your options?
In relative terms, the high-quality, highly liquid blue-chip assets will become expensive. So we end up with especially high price-to-earnings ratios and consistently negative real yields on safe government securities. Those price patterns don’t have to be bubbles. If this state of affairs persists, with a shortage of safe investment opportunities, those prices can stay high for a long time. They may go up further yet.
These high asset prices do reflect a reality of wealth creation. They are broadly bullish at the global scale, but they don’t have to demonstrate much if any good news about those assets per se. Rather there is an imbalance between world wealth and safe ways of transferring that wealth into the future
To sum this all up in a single nerdy finance sentence, in a world where wealth creation has outraced the evolution of good institutions, the risk premium may be more important than you think.
Except for this business about "shortage of safe assets," that's pretty much the intuition. (Tyler: all assets are in fixed supply in the short run. Prices adjust. This isn't really a ``shortage.'') The point that high valuations extend to homes, bonds, bitcoins, and global stocks is a good indicator that the phenomenon is generalized risk aversion rather than something specific to one market or economy.
This view should not necessarily make you sleep at night however. It means that a downturn will be accompanied by higher risk aversion again, and not only will dividends fall, prices will fall further. Moreover, historically, asset price falls have been preceded by periods of higher volatility. Alas, many periods of higher volatility have just faded away, so it's a warning sign not a signal. Sure, this mechanism means they will bounce back, but if you are clairvoyant enough to see it coming it will be better to avoid the fall! If not, well, be read to buy when everyone else is scared -- if you are one of the lucky few who can afford not to be scared.
The VIX, volatility, technical factors
There is another kind of ``discount factor variation,'' including 1987 and the flash crash. Sometimes the machinery of markets gets in the way, and prices fall more than they should. They quickly bounce back. If you can buy at the bottom you can make a fortune, but the prices fell precisely because it's hard to buy.
There were scattered report on Monday of hours long delays for retail customers to trade. (Can't find link.) But I do not get a sense this was a big clog in the markets. I would be curious to hear from people closer to markets.
The bigger news is the return of volatility -- big daily changes. To put this in historical perspective, here are two plots


The surprise, really, is just how low low volatility had become. Historically the stock market index has had a volatility around 15-20% per year -- a typical year saw a 15-20% change, and a typical day saw a \(15-20 / \sqrt{250} \approx \) one percent change. But, as you see in the top graph, volatility also declines in the late summer of the business cycle. Volatility has many occasional little eruptions, typically around price drops, and then washes away. Except when volatility rises in advance of the next recession and market decline. Which is this? I wish I knew.
Volatility is not about "fear" nor is it about "uncertainty." Volatility occurs when options change quickly. Constant bad news or good news just leads to constantly low or high prices. This is a sign of a time when either a lot of real information is hitting the market, or a lot of people are trying to process what's going on ahead of everyone else.
The "VIX bust" is hot in the news. A lot of people bet that the graph you saw above would not rise. To be ``short volatility'' means basically that you write insurance to people who worry about markets going down, (volatility is a big part of the value of put options) and you write insurance to people who are worried about events like right now in which markets start to move a lot. Hello, when you write insurance, occasionally you have to pay up.
As the graphs make clear, writing volatility insurance, or betting that volatility will continue to go down, is like writing earthquake insurance. Not much happens for many years in a row, and you can post nice profits. Then it jumps and you lose big time. Anyone who did this based just on historical returns is now crying the tears of the greedy neophyte. But they have lots of company. Back in the 1990s, Long Term Capital Management went under, basically for betting that similar looking graphs would continue to go down.
Well, if after all these years people are at it, P.T. Barnum had a good word for them. But did this have something to do with the stock market crash? How Bets Against Volatility Fed the Stock Market Rout in WSJ is an example of this train of thought.
On first glance, sure, a lot of people lost a ton of money, and then sold out other risky positions. But Econ 101: for every buyer there is a seller. Derivatives contracts are pure cases of this fact -- the net supply really is zero, for everybody who lost a dollar shorting VIX somebody else made a dollar buying it.
To get a story like this to go you need all sorts of market discombobulations. Somehow the people who lost money must be more important to markets than the people who made money. This can happen -- if a bunch of traders in a complex obscure security all lose money, and all try to sell, there is nobody to buy. But I don't really see that case here, and stocks are not a complex obscure security.
A trader friend also tells me that he has seen lots of people stop hedging -- so sure low volatility would continue that they don't cover the downside. He said many have lost a ton, and now are frantically selling to cover their positions. Such price pressure can have short run impacts, but does not last long.
Inflation and real interest rates
So we're back at hints of higher long-term real interest rates as the main likely culprit behind this week's decline and gyrations.
Here too most of the stories don't make much sense. Inflation per se should not make much difference. If expected inflation rises, interest rates rise, but real interest rates are unaffected. Inflation may make the Fed act more quickly, but there is not much correlation between what the Fed does with short term rates and the behavior of 10 year or more rates that matter to the stock market -- or to corporate investment.

Yes, there is some correlation -- especially at the end of expansions, short and long rates rise together. But the correlation is a whole lot less than the usual Wizard of Oz behind the curtain stories. And even the Fed cannot move real rates for very long. There is a good chicken-and-egg question whether the Fed can hold short rates down for long when long rates want to rise. The Fed pretty much has to jump in front of the parade and pretend to lead it.
Inflation does seem finally to be rising. The fact that higher rates are associated with the dollar falling suggests that a lot of the higher rates are due to inflation, and TIPs have not moved (top graph.)
So, the question before us is, are long-term real rates finally rising -- back to something like the historical norm that held for centuries, and if so why?
The good story is that we are entering a period of higher growth. Depending on your partisan tastes, point to tax cuts and deregulation, or state that Obama medicine is finally kicking in. This would raise real growth, with \(\gamma>1\) lead to a small stock price decline, but higher stock returns and bond returns going forward.
There is a bad story too. Having passed a tax cut that left untouched will lead to trillion-dollar deficits, Congressional leaders just agreed to $300 billion more spending. The Ryan plan that tax cuts would be followed by entitlement reform may be evaporating. Publicly held debt is $20 trillion. At some point bond markets say no, and real rates go up because the risk premium goes up. The US is in danger that higher interest rates mean higher interest costs on that debt, which means higher deficits, which means higher interest rates. $20 trillion times 5% interest = $1 trillion in interest costs.
The former leads to some inflation if you believe in the Phillips curve. The latter leads to stagflation in a tight fiscal moment.
Which is it? I don't know, I'm an academic not a trader.
One consolation of the stock market decline: I hope we don't have to hear how all the corporate tax cut did was to boost the stock market!
Well, two days ago this was going to be a short post responding to the WSJ's view that the Fed is behind it all, and Tyler's nice intuition. It got a bit out of hand, but I hope it's still interesting.
****
Data Update (Geeks only).
P/D isn't really "better" than P/E or other measures. A measure is what it is, you have to specify a question before there is an answer. Ideally, we want a measure that isolates expected returns, and tells us if prices are higher or lower given the level of expected dividends. So ideally, we would account for expected future dividends and the result would be a pure measure of expected returns (rational or not). P/D works pretty well that way because dividends are not very forecastable. Price divided by this year's dividends turns out to be a decent approximation to price divided by anyone's forecast of future dividends. But not perfect. P/E is less good that way because earnings bat about a bit more than dividends. For individual companies you can't use P/D, because so many of them do not pay dividends. Following Fama and French, the ratio of market value to book value is better there, because book value is usually positive, or not so frequently zero.
I use the CRSP definitions. I start from the CRSP return with and without dividends and infer the dividend yield. ''Dividends" here includes not only cash dividends but all cash payments to shareholders. So, if your small company gets bought by Google, and the shareholders get cash, that is a "dividend" payout. I suspect this accounts for the difference noted by WC Varones below. As others point out, earnings has all sorts of measurement issues, and also does not control for leverage.
Dividends are very seasonal, so you can't divide price by this month's dividends or you get a lot of noise. I use the last year's worth of dividends, brought forward by reinvesting them. This introduces some "return" into the dividend series. If you just sum dividends, though, identities like \(R_{t+1} = (P_{t+1}+D_{t+1})/P_t \) no longer hold in your annual data.
x = load('crsp_nyse_new_2018.txt');
caldt = x(:,1);
totval = x(:,2);
usdval = x(:,3);
sprtrn = x(:,4);
spindx = x(:,5);
vwretd = x(:,6);
vwretx = x(:,7);
[yr,mo,day,crsp_date_number] = decode_date(caldt);
T = size(vwretd,1);
vwretda = (1+vwretd(1:T-11)).*(1+vwretd(2:T-10)).*(1+vwretd(3:T-9)).*...
(1+vwretd(4:T-8)).*(1+vwretd(5:T-7)).*(1+vwretd(6:T-6)).*...
(1+vwretd(7:T-5)).*(1+vwretd(8:T-4)).*(1+vwretd(9:T-3)).*...
(1+vwretd(10:T-2)).*(1+vwretd(11:T-1)).*(1+vwretd(12:T));
vwretxa = (1+vwretx(1:T-11)).*(1+vwretx(2:T-10)).*(1+vwretx(3:T-9)).*...
(1+vwretx(4:T-8)).*(1+vwretx(5:T-7)).*(1+vwretx(6:T-6)).*...
(1+vwretx(7:T-5)).*(1+vwretx(8:T-4)).*(1+vwretx(9:T-3)).*...
(1+vwretx(10:T-2)).*(1+vwretx(11:T-1)).*(1+vwretx(12:T));
vwdp = vwretda./vwretxa-1; %D_t+1/P_t+1 = [(P_t+1+D_t+1)/P_t] / [P_t+1/P_t] -1;
vwdda = vwdp(13:end)./vwdp(1:end-12).*vwretxa(13:end); % D_t+1/D_t = D_t+1/P_t+1 / D_t/P_t * P_t+1/P_t
vwdda = [ones(23,1)*NaN; vwdda];
cumval = cumprod(1+vwretd);
vwdp = [ ones(11,1)*NaN; vwdp]; % keep length of series the same
I get stock data from CRSP via WRDS. This is the NYSE only. I can't post the full data, as it belongs to CRSP. Here is an excerpt that will let you calculate the last year, and check that things are right if you download the whole thing.
%crsp_nyse_new_2018.txt
% caldt totval usdval sprtrn spindx vwretd vwretx
19260130 27624240.80 27412916.20 0.022472 12.74 0.000561 -0.001395
19260227 26752064.10 27600952.10 -0.043956 12.18 -0.033046 -0.036587
19260331 25083173.40 26683758.10 -0.059113 11.46 -0.064002 -0.070021
19260430 25886743.80 24899755.60 0.022688 11.72 0.037019 0.034031
...
20160129 17059005700.00 17976992500.00 -0.050735 1940.24 -0.050111 -0.051700
20160229 16986848800.00 17001893900.00 -0.004128 1932.23 0.005104 0.002251
20160331 18122913200.00 16951468600.00 0.065991 2059.74 0.072190 0.069562
20160429 18503144900.00 18082712100.00 0.002699 2065.30 0.023324 0.021716
20160531 18479138100.00 18410229900.00 0.015329 2096.96 0.006124 0.003392
20160630 18613173100.00 18422135300.00 0.000906 2098.86 0.011175 0.008957
20160729 19054705700.00 18557630600.00 0.035610 2173.60 0.028433 0.026872
20160831 18993464300.00 19049575300.00 -0.001219 2170.95 0.000196 -0.002532
20160930 18829544800.00 18880924600.00 -0.001234 2168.27 -0.003876 -0.005878
20161031 18404742600.00 18802632900.00 -0.019426 2126.15 -0.021331 -0.022944
20161130 19220882900.00 18383296300.00 0.034174 2198.81 0.048548 0.045701
20161230 19568491300.00 19178151000.00 0.018201 2238.83 0.021566 0.019486
20170131 19824534000.00 19526674900.00 0.017884 2278.87 0.014007 0.012623
20170228 20355248600.00 19781803200.00 0.037198 2363.64 0.031422 0.028905
20170331 20237616500.00 20334429600.00 -0.000389 2362.72 -0.003961 -0.006103
20170428 20286715000.00 20194157100.00 0.009091 2384.20 0.003950 0.002468
20170531 20299003900.00 20276905500.00 0.011576 2411.80 0.002199 -0.000507
20170630 20602218600.00 20256933000.00 0.004814 2423.41 0.018204 0.016235
20170731 20747539100.00 20488018000.00 0.019349 2470.30 0.015290 0.013394
20170831 20593088100.00 20742392900.00 0.000546 2471.65 -0.005133 -0.007874
20170929 21147810200.00 20381001300.00 0.019303 2519.36 0.030435 0.028662
20171031 21343546700.00 21130998500.00 0.022188 2575.26 0.011831 0.010360
20171130 21904734200.00 21302790800.00 0.028083 2647.58 0.030537 0.027670
20171229 22016063100.00 21683038400.00 0.009832 2673.61 0.015914 0.014117
If I screwed up, let me know and I'll fix it!
Truck automation
Two bits from Marginal Revolution on truck automation are so good they merit passing on here. Dan Hanson writes this amazing comment
The comment was on an earlier MR post covering Alexis Madrigal in the Atlantic on self-driving trucks. Automation in any industry reduces costs and increases quality. These mean the industry expands, so labor demand may even grow. Think of the computer you're reading this on. Labor gets to specialize at the things people are good at, which is higher productivity, and wages rise.
And I just googled "truck driver shortage" to get the latest media story to rediscover this fact. From NPR "Trucking Industry Struggles With Growing Driver Shortage",
(Of course we don't use the word "shortage" in economics unless there is a government-imposed price control. This just means wages will go up.)
Update: Thanks to the comment from Unknown below, here is the response from Tom T in MRs comments
I wonder how many of the people making predictions about the future of truck drivers have ever ridden with one to see what they do?
One of the big failings of high-level analyses of future trends is that in general they either ignore or seriously underestimate the complexity of the job at a detailed level. Lots of jobs look simple or rote from a think tank or government office, but turn out to be quite complex when you dive into the details.
For example, truck drivers don’t just drive trucks. They also secure loads, including determining what to load first and last and how to tie it all down securely. They act as agents for the trunking company. They verify that what they are picking up is what is on the manifest. They are the early warning system for vehicle maintenance. They deal with the government and others at weighing stations. When sleeping in the cab, they act as security for the load. If the vehicle breaks down, they set up road flares and contact authorities. If the vehicle doesn’t handle correctly, the driver has to stop and analyze what’s wrong – blown tire, shifting load, whatever.
In addition, many truckers are sole proprietors who own their own trucks. This means they also do all the bookwork, preventative maintenance, taxes, etc. These people have local knowledge that is not easily transferable. They know the quirks of the routes, they have relationships with customers, they learn how best to navigate through certain areas, they understand how to optimize by splitting loads or arranging for return loads at their destination, etc. They also learn which customers pay promptly, which ones provide their loads in a way that’s easy to get on the truck, which ones generally have their paperwork in order, etc. Loading docks are not all equal. Some are very ad-hoc and require serious judgement to be able to manoever large trucks around them. Never underestimate the importance of local knowledge.
... a fundamentally Hayekian insight: When it comes to large scale activities, nothing about change is easy, and top-down change generally fails...I would add silicon valley software companies, and media commentators to the think tanks and government offices, on the list of pundits that tend to denigrate the skill, knowledge and intelligence required of what are very wrongly call "low skilled" jobs. I note several times the "paperwork" required in trucking as well.
The comment was on an earlier MR post covering Alexis Madrigal in the Atlantic on self-driving trucks. Automation in any industry reduces costs and increases quality. These mean the industry expands, so labor demand may even grow. Think of the computer you're reading this on. Labor gets to specialize at the things people are good at, which is higher productivity, and wages rise.
Uber does not believe that self-driving trucks will be doing “dock to dock” runs for a very long time. They see a future in which self-driving trucks drive highway miles between what they call transfer hubs, where human drivers will take over for the last miles through complex urban and industrial terrain.And fill out that paperwork.
if the self-driving trucks are used far more efficiently, it would drive down the cost of freight, which would stimulate demand, leading to more business. And, if more freight is out on the roads, and humans are required to run it around local areas, then there will be a greater, not lesser, need for truck drivers.The article misses the second, more important effect. As low-cost trucking expands, other businesses that use trucks expand, and they hire people too.
And I just googled "truck driver shortage" to get the latest media story to rediscover this fact. From NPR "Trucking Industry Struggles With Growing Driver Shortage",
The trucking industry is facing a growing shortage of drivers that is pushing some retailers to delay nonessential shipments or pay high prices to get their goods delivered on time.
A report from the American Trucking Associations says more than 70 percent of goods consumed in the U.S. are moved by truck, but the industry needs to hire almost 900,000 more drivers to meet rising demand.It's a tough job. Young people aren't going in to it. There are competing opportunities. My last Uber driver just quit long-haul truck driving. He earns a bit less, but gets to see his family every night.
(Of course we don't use the word "shortage" in economics unless there is a government-imposed price control. This just means wages will go up.)
Update: Thanks to the comment from Unknown below, here is the response from Tom T in MRs comments
This comment reminds me of the guy in Office Space who ends up helplessly screaming at the downsizing consultants, “I have people skills!”
It’s trying way too hard. Sure, the truckers do all of these things. But is there any reason to think that the self-driving AI won’t be just as good, if not far better, at confirming that the load is secure, verifying the manifest, monitoring vehicle maintenance, and interfacing with the weigh station? Does anyone really think a computer can’t split loads and optimize returns? Even accepting the dubious premise that the poor driver is somehow providing effective security by sleeping in the cab in front of the load, the whole need for that sleep-time security disappears when the vehicle is self-driving and doesn’t have to sleep. Truckers who are self-employed and have to do bookwork, taxes, and customer relationships will have a lot more time to devote to that end of the operations if they don’t also have to drive the truck. Loading docks that are ad hoc will find themselves either standardizing or paying extra for failing to do so, like every other aspect of an industrial, computerized world.
I’ve been a litigator for 25 years. At one time, we saw our profession as so paper-based and quirky and fact-dependent that it would always be safe from automation. Sure enough, OCR text recognition, keyword searches, and predictive algorithms completely changed the economics of document review. No one is immune from automation.I heard somewhere, I forget where, the quip that the ones who really should fear automation are accountants, book keepers, and other fairly routine paperwork office workers. It sounds awfully sensible. Of course our government is pretty good at expanding the demand for paperwork!
Convexification and complication
From Richard Rubin at WSJ:
In economics we call this "convexification". There are lots of clever ways to draw lines through a stair step.
Of course, you can also just give $50,000 to charity in alternate years, and let the charity put it in the bank. Donor-advised funds are useful if you think your local charity's endowment investment policy isn't that smart. If they invest in obscure high-fee hedge funds and private equity deals and you'd rather they invested your money in transparent low-fee assets, then set up a donor-advised fund.
In a rare moment of sanity and good government from my ex-home state, Marc Levine, chairman of the Illinois state board of investment, pulled all of Illinois' pension assets out of high-fee obscure hedge funds.
Donor-advised funds are also a great way to give money to your favorite charity if you think their own investment
The article includes more clever advice:
It gets better though. Give a non-market asset to your favorite charity. You can see both you and the charity have every incentive to report fanciful values for the asset. If it's really worth $100, well, call it $200 for the IRS. The charity still gets $100 for free.
Now you can actually make money out of donations. Conservation easement syndications (here, here and most fun here are even better. Buy land cheap, declare a huge value, put the land in a conservation trust, promising not to build houses on it -- actual operating golf courses are ok, and too bad if sometime in 2050 building some houses is a good idea -- and deduct the high value against other income.
Obviously, I'm not such a fan. Even if you take a benign view -- the US likes to pass very high taxes for symbolic purposes, and then allows all sorts of shenanigans on the side so people don't actually have to pay the taxes -- much of the economic damage is done. Aside from the fact that marginal disincentives are high, the cost of all this stuff is not trivial either. From the first article
But even that is not the most annoying part. Now, on top of everything else, a wise taxpayer needs to set up a donor advised fund, sign a bunch of papers, and manage it each year. Already, perfectly normal citizens have to have trusts to manage estates, and hundreds of pages of tax forms each year. The needless complexity of life in the Republic of Paperwork is, to me, the most annoying part. We need a grand simplification of our public life. If this is what it leads to, the whole charitable deduction thing should get tossed overboard.
The new tax law’s treatment of deductions gives people more reasons to concentrate giving in certain years, both inside and outside donor-advised funds.
A donor-advised fund is an investment account held for charitable purposes. Donors take tax deductions when they put money in, then recommend grants to charities over time.
Mr. Young,...added $30,000 to a donor-advised fund run by the Los Altos Community Foundation. His plan: alternate years between taking the standard deduction and donating to his fund and claiming itemized deductions.How very clever. The tax law allows a $24,000 per year standard deduction. Arrange things so that in some years you have zero actual deductions, and get $24,000 free deduction. Pile all the real deductions into other years.
In economics we call this "convexification". There are lots of clever ways to draw lines through a stair step.
Of course, you can also just give $50,000 to charity in alternate years, and let the charity put it in the bank. Donor-advised funds are useful if you think your local charity's endowment investment policy isn't that smart. If they invest in obscure high-fee hedge funds and private equity deals and you'd rather they invested your money in transparent low-fee assets, then set up a donor-advised fund.
In a rare moment of sanity and good government from my ex-home state, Marc Levine, chairman of the Illinois state board of investment, pulled all of Illinois' pension assets out of high-fee obscure hedge funds.
Industry “experts” suggested we keep these investments to diversify our holdings and reduce overall risk. Yet we already owned bonds for that purpose. Our Procter & Gamble bonds made sense to us. I’m pretty sure my children will brush their teeth tonight. But I don’t have a clue about that long-lumber, short-sugar trade.
Did anyone at the table really understand what these hedge funds were doing? Should we be putting the retirement funds of Illinois state employees into investments that not a single trustee, consultant or staffer could explain?
Donor-advised funds are also a great way to give money to your favorite charity if you think their own investment
The article includes more clever advice:
... Donors who give appreciated assets get an added benefit: They avoid paying capital-gains taxes when they make the donation, and they get a deduction against their income taxes for the full value of the asset.If you paid $50 for stock, now worth $100, give the stock to your favorite charity (Hoover!). The charity gets $100, you take $100 off your taxes, but you don't pay capital gains taxes on the $50. Essentially you get to take $100 plus the capital gains tax as a deduction.
It gets better though. Give a non-market asset to your favorite charity. You can see both you and the charity have every incentive to report fanciful values for the asset. If it's really worth $100, well, call it $200 for the IRS. The charity still gets $100 for free.
Now you can actually make money out of donations. Conservation easement syndications (here, here and most fun here are even better. Buy land cheap, declare a huge value, put the land in a conservation trust, promising not to build houses on it -- actual operating golf courses are ok, and too bad if sometime in 2050 building some houses is a good idea -- and deduct the high value against other income.
the former Millstone golf course outside Greenville, S.C. Closed back in 2006, it sat vacant for a decade...In 2015, the owner put the property up for sale, asking $5.8 million. When there were no takers, he cut the price to $5.4 million in 2016.
Later in 2016, however, a pair of promoters appeared. They gathered investors who purchased the same parcel at the market price and, with the help of a private appraiser, declared it to be worth $41 million, nearly eight times its purchase price. Why? Because with that new valuation and a bit of paperwork, the investors were suddenly able to claim a tax deduction of $4 for each $1 they invested. ..
...A preliminary IRS analysis of syndicated partnerships this summer showed investors claimed an average of $9 in tax deductions for every dollar they invest.There are lots of ways to interpret all this. One can celebrate the creativity of the American tax lawyer and wealthy investor. Who said innovation has fled the US?
Obviously, I'm not such a fan. Even if you take a benign view -- the US likes to pass very high taxes for symbolic purposes, and then allows all sorts of shenanigans on the side so people don't actually have to pay the taxes -- much of the economic damage is done. Aside from the fact that marginal disincentives are high, the cost of all this stuff is not trivial either. From the first article
The funds linked to investment firms such as Fidelity and Vanguard typically charge administrative fees... The funds are often invested in vehicles managed by those firms and generate fees for the for-profit business.And the lawyers who set up conservation trusts, and the lobbyists who keep them in the tax code, are all taking their cut too.
But even that is not the most annoying part. Now, on top of everything else, a wise taxpayer needs to set up a donor advised fund, sign a bunch of papers, and manage it each year. Already, perfectly normal citizens have to have trusts to manage estates, and hundreds of pages of tax forms each year. The needless complexity of life in the Republic of Paperwork is, to me, the most annoying part. We need a grand simplification of our public life. If this is what it leads to, the whole charitable deduction thing should get tossed overboard.
Summary of study on well-being and self-control in the Irish population
On January 25, 2018, we presented new data on well-being and self-control in the Irish population at the Institute of Banking. We conducted a study using the Day Reconstruction Method (DRM) with Amarach Research and asked almost 1000 Irish individuals to tell us about three episodes they experienced “Yesterday”. Below are some graphs from the presentation and some further reading and offers a snapshot of the many potential uses of such data across contexts.
If you like to know more about the study or are interested in running similar studies yourself, please contact Liam Delaney (liam.delaney@ucd.ie) or Leonhard Lades (leonhard.lades@ucd.ie).
Illustrative findings:
Further reading:
If you like to know more about the study or are interested in running similar studies yourself, please contact Liam Delaney (liam.delaney@ucd.ie) or Leonhard Lades (leonhard.lades@ucd.ie).
Illustrative findings:
 |
| Figure 1: Four experiences during the day. |
 |
| Figure 2: When did people engage in different activities? |
 |
| Figure 3: How positive did people feel during different activities? |
 |
Figure 4: How many desires did people have and how many desires led to self-control failures. We define self-control failures as desires that are (i) conflicting, (ii) attempted to be resisted, and (iii) nonetheless enacted. Hence of the 1932 desires we recorded, 295 led to a self-control failure. |
 |
Figure 5: In which domains did desires (the length of each bar) and self-control failures (coded in red) occur? |
 |
| Figure 6: When and in which domains did desires occur? |
 |
| Figure 7: When and in which domains did self-control failures occur? |
 |
Figure 8: The links between desire enactment, use of self-control, and positive experiences. On the left we see that people have more positive feelings when they enact a given desire (versus when they do not enact it), given that people to not try to resist enacting the desire. That is in line with previous literature. However, on the right we see that the same "enactment-boost" is present, when people tray to resist enacting. The latter is contrary to recent findings and suggests that people "might just enjoy it" despite being a self-control failure. |
 |
| Figure 9: Trait self-control across the population color coded in low, medium, and high. |
 |
| Figure 10: Especially in the first half of the day, people with low trait self-control are more tired than people with high trait self-control. |
Further reading:
Delaney, L., & Lades, L. K. (2017). Present Bias and Everyday Self‐Control Failures: A Day Reconstruction Study. Journal of Behavioral Decision Making, 30(5), 1157-1167.
Hofmann, W., Baumeister, R. F., Förster, G., & Vohs, K. D. (2012). Everyday temptations: an experience sampling study of desire, conflict, and self-control. Journal of personality and social psychology, 102(6), 1318.
Hofmann, W., Kotabe, H., & Luhmann, M. (2013). The spoiled pleasure of giving in to temptation. Motivation and Emotion, 37(4), 733-742.
Kahneman, D., Krueger, A. B., Schkade, D. A., Schwarz, N., & Stone, A. A. (2004). A survey method for characterizing daily life experience: The day reconstruction method. Science, 306(5702), 1776-1780.
9 hour railway station
China builds a railway station in 9 hours (HT Marginal Revolution).
Yes, it's basically a propaganda video, but interesting nonetheless as a reflection on infrastructure. The video does not say how long China spent on environmental review -- did it disturb wetlands, threaten various species, what's it's carbon footprint -- legal review -- is it paying prevalining union wages, was it bid with proper female and minority headed construction company set asides -- did it have community input, consistency with planning targets and so on. I doubt it was the oh, 10 years or so that takes in the US.
To be clear, I am not saying all that is useless. China has awful pollution, and our reviews accomplish something. China doesn't bother with the niceties of private property ownership, eminent domain proceedings, and legal challenges when they want to build a railway. These don't just triple or more the cost of projects, send vast sums of money to well-connected companies and lawyers and lobbyists, and delay projects for decades. But they also have that effect.
It's also interesting as a pin factory visit. With that many people on a job, I would have thought they would be getting in each other's way. This video seems to deny the Q theory of investment! Some are standing, but a remarkable number are working hard. Of course, the video is edited.
When I watch US infrastructure projects, I see a lot of people standing around or "supervising" the one poor sob who is actually doing the work. That ratio seems a lot lower here.
There are a lot of machines. The days of China substituting lots and lots of labor for capital are gone. The Chinese have taken Milton Friedman's advice. (On a visit to a dam, Friedman noticed people using shovels. He asked why they didn't use bulldozers. The answer was to give more people employment. Friedman responded, why then don't you make them use spoons?) This is not a new observation, but the video is a good reminder from afar.
Derville Rowland Speaks at Behavioural Research Group
Derville Rowland will speak on "Financial Conduct Regulation: Why Understanding Behaviour Matters.". The talk takes place on Wednesday 7th February at 930am in the UCD Geary Institute seminar room. The talk will be followed by a Q+A session ending at 1030am.
Speaker Biography: Derville Rowland was appointed Director General (Financial Conduct) in the Central Bank of Ireland on 1 September 2017 and is responsible for consumer protection, securities and markets supervision, enforcement and policy and risk. Derville is a member of the European Securities and Market Authority (ESMA).Prior to this appointment, Derville was the Director of Enforcement in the Central Bank, where she established and developed the Enforcement Directorate. Previous to this, Derville gained extensive litigation and regulatory experience while practising law at the bar and working as in-house regulatory counsel. Derville is a qualified barrister having being called to the bar in 1996 (Inns of Court School of Law; Inner Temple) and subsequently in 2003 (Kings Inns Dublin).
Speaker Biography: Derville Rowland was appointed Director General (Financial Conduct) in the Central Bank of Ireland on 1 September 2017 and is responsible for consumer protection, securities and markets supervision, enforcement and policy and risk. Derville is a member of the European Securities and Market Authority (ESMA).Prior to this appointment, Derville was the Director of Enforcement in the Central Bank, where she established and developed the Enforcement Directorate. Previous to this, Derville gained extensive litigation and regulatory experience while practising law at the bar and working as in-house regulatory counsel. Derville is a qualified barrister having being called to the bar in 1996 (Inns of Court School of Law; Inner Temple) and subsequently in 2003 (Kings Inns Dublin).
News comments
The tariff and the wall were the big news this week, with some lessons for looming infrastructure.
The Tariff
30% on solar cells, 20-50% on washing machines. Since the ill effects of tariffs have been know for, oh, about 250 years, said again eloquently by the Wall Street Journal in Trump starts his trade war, Let me try to offer some comments beyond the usual economist response -- comparative advantage, trade must balance, follow the money anything that goes overseas must come back, imported products are inputs too, solar cell installers need jobs too, blahdah blahdah blahdah.
Washing machines, a device unknown to the inside the beltway types, is how the rest of us clean clothes. So raising the price of washing machines is one more little sucker punch to people who wash their own clothes.
Solar panels are supposed to save the planet. Our government already subsidizes them heavily via tax deductions, credits, Solyndras, renewable mandates, and so on, with the purpose of lowering carbon emissions. If that is the purpose, then we want the cheapest panels around to compete with fossil fuels. If that means made in Malaysia, great. The planet does not care where they are made.
If the Chinese government wants to tax its citizens to send us artificially cheap solar panels, we should thank them for their generosity in helping us to save the planet. It's absolutely hilarious to see complaints that China is subsidizing its solar cell industry so merits retaliation, given how much subsidy they receive here.
Yet even Al Gore agrees that the tariff is a good idea and wants solar cells made in the US.
What's going on? I think there is a good lesson in political economy. Once a government starts subsidizing something, everyone lines up at the trough. If taxpayers are going to be on the hook, then every interest wants its share. So potentially sensible carbon policy ends up as one more boondoggle.
Related, this week I saw the brilliant post Solar panels cost twice as much to install in the US as in Australia. (HT marginal revolution.) The answer, as usual in what Mark Steyn calls the Republic of Paperwork, is the paperwork.
I loved the flowchart on what it takes to get solar installed. In particular, you see here a real person who has really done it. The rules just say ``get a permit'' but the actual process, laid out in the picture, takes many trips back and forth and negotiations with the permit granters, all on someone's paid time.

This is a lovely detailed example of a larger question -- just what is the cost of regulation? I've been having this back and forth with some liberal economist friends, who pooh pooh the idea that regulations cost a lot. And here the official paperwork act disclosures, pages of the federal register, and so on would not add up to much. Yet, it does add up, to double. And installing residential solar is pretty simple, and something governments say they want. If this example scales, than GDP is half what it could be with a simper regulatory system.
Back to tariffs. Just why is it so hard to grasp that tariffs are a bad idea? Well, it must be because it is hard, and illustrates perhaps why economics really is useful, and why "business experience" is not generally a good qualification for policy. Anything that reduces competition and drives prices up is good for an individual business. Business leaders know this. Take that business leader to Washington and he or she will quickly conclude that what's good for my business is good for yours. A tariff on everything! Reduce harmful competition everywhere! We call it the fallacy of composition. What is good for one business is not good for all businesses, because that one business is profiting at the expense of everyone else. Business or banking experience does not generalize to good policy.
(Update:) But it's not just the administration that is to blame. The trade law that the administration applies specifies that tariffs are to be imposed if domestic companies are hurt by imports. That's an absurd blatantly protectionist standard. We have relied for years on the trust that administrations would not be so stupid as to actually enforce the law as written."Well, if one comes along that is, perhaps it's time to rewrite the law. If the law said only that tariffs are imposed if american consumers are hurt by imports, or even the american economy as a whole is hurt by imports, much of this mischief would go away.
Congress can, and should fix this. Perhaps as with DACA, the Trump Administration actually executing the law as written by Congress will spur Congress to fix its absurd law. Get rid of the Jones act (all shipments to/from American ports on US built, operated, and staffed ships) while you're at it.
The Wall and infrastructure
A deal seems to be emerging, one that I advanced almost as a joke at faculty lunches. But it may happen. Give him his Wall, and get pretty much whatever you want in return.
From Trump's immigration offer
Such is infrastructure in the US today.
Can you imagine what will happen with the Wall, even if Congress appropriates $25 billion? It will instantly be in court. Start with environmental challenges. It will of course interrupt the migration path of the Eastern Arizona accelerati incredibilus. It will disrupt holy native lands and archeological sites. Mexicans are largely catholic, so suits will claim the wall is religious discrimination. Heck, infrastructure has to pass cost benefit tests, and good luck with that one. The contracting was improperly done. State attorney generals busy suing the Trump administration will quickly add to this one.
As with solar cells, as with the second avenue subway, as with the high speed train, as with the Keystone pipeline, good luck building any infrastructure in America today -- and especially good luck building one that makes little sense and is a highly politicized hot potato.
If they gave the President all he wanted, tomorrow, this thing would not be out of court for decades, long after a democratic congress or administration kills it.
They can afford to give him a symbolic victory. If, well, they decide that they can afford politically to give him a symbolic victory. For that is all it will ever be. And frankly, even $25 billion of waste to fix immigration would not be a bad tradeoff. The waste to our country in the current immigration system is on the back of my envelope orders of magnitude greater than that.
Looking forward to infrastructure.
As reported in the Wall Street Journal
The point of the article was that the Administration would like this to be reduced to two years. Good luck with that. The other point of the article is environmental groups lining up to fight any streamlining of the permitting process. Strategic delay rather than policy outcome is vital to them, apparently.
But the administration is right. If infrastructure is going to be built in the US, it strikes me that reforming the process for building infrastructure is the key. If home zoning and inspection requirements double the cost of residential solar cells, if prevailing wage, union work rules, and a hundred other impediments mean that subways cost billions of dollars per mile, many multiples of what they cost in France let alone China, and if permits take decades, and billions more of consultant and legal work, our problem with infrastructure is not finding the money to pay for it.
In the meantime, I offer a final suggestion to the Trump team: Offer to build a high speed train along the border instead! Just forget to put in any crossings.
(Update: I am just now reminded by a story on NPR that President Trump had, as a candidate, suggested coating the wall in solar cells. Truth is stranger than fiction.)
The Tariff
30% on solar cells, 20-50% on washing machines. Since the ill effects of tariffs have been know for, oh, about 250 years, said again eloquently by the Wall Street Journal in Trump starts his trade war, Let me try to offer some comments beyond the usual economist response -- comparative advantage, trade must balance, follow the money anything that goes overseas must come back, imported products are inputs too, solar cell installers need jobs too, blahdah blahdah blahdah.
Washing machines, a device unknown to the inside the beltway types, is how the rest of us clean clothes. So raising the price of washing machines is one more little sucker punch to people who wash their own clothes.
Solar panels are supposed to save the planet. Our government already subsidizes them heavily via tax deductions, credits, Solyndras, renewable mandates, and so on, with the purpose of lowering carbon emissions. If that is the purpose, then we want the cheapest panels around to compete with fossil fuels. If that means made in Malaysia, great. The planet does not care where they are made.
If the Chinese government wants to tax its citizens to send us artificially cheap solar panels, we should thank them for their generosity in helping us to save the planet. It's absolutely hilarious to see complaints that China is subsidizing its solar cell industry so merits retaliation, given how much subsidy they receive here.
Yet even Al Gore agrees that the tariff is a good idea and wants solar cells made in the US.
What's going on? I think there is a good lesson in political economy. Once a government starts subsidizing something, everyone lines up at the trough. If taxpayers are going to be on the hook, then every interest wants its share. So potentially sensible carbon policy ends up as one more boondoggle.
Related, this week I saw the brilliant post Solar panels cost twice as much to install in the US as in Australia. (HT marginal revolution.) The answer, as usual in what Mark Steyn calls the Republic of Paperwork, is the paperwork.
I loved the flowchart on what it takes to get solar installed. In particular, you see here a real person who has really done it. The rules just say ``get a permit'' but the actual process, laid out in the picture, takes many trips back and forth and negotiations with the permit granters, all on someone's paid time.
This is a lovely detailed example of a larger question -- just what is the cost of regulation? I've been having this back and forth with some liberal economist friends, who pooh pooh the idea that regulations cost a lot. And here the official paperwork act disclosures, pages of the federal register, and so on would not add up to much. Yet, it does add up, to double. And installing residential solar is pretty simple, and something governments say they want. If this example scales, than GDP is half what it could be with a simper regulatory system.
Back to tariffs. Just why is it so hard to grasp that tariffs are a bad idea? Well, it must be because it is hard, and illustrates perhaps why economics really is useful, and why "business experience" is not generally a good qualification for policy. Anything that reduces competition and drives prices up is good for an individual business. Business leaders know this. Take that business leader to Washington and he or she will quickly conclude that what's good for my business is good for yours. A tariff on everything! Reduce harmful competition everywhere! We call it the fallacy of composition. What is good for one business is not good for all businesses, because that one business is profiting at the expense of everyone else. Business or banking experience does not generalize to good policy.
(Update:) But it's not just the administration that is to blame. The trade law that the administration applies specifies that tariffs are to be imposed if domestic companies are hurt by imports. That's an absurd blatantly protectionist standard. We have relied for years on the trust that administrations would not be so stupid as to actually enforce the law as written."Well, if one comes along that is, perhaps it's time to rewrite the law. If the law said only that tariffs are imposed if american consumers are hurt by imports, or even the american economy as a whole is hurt by imports, much of this mischief would go away.
Congress can, and should fix this. Perhaps as with DACA, the Trump Administration actually executing the law as written by Congress will spur Congress to fix its absurd law. Get rid of the Jones act (all shipments to/from American ports on US built, operated, and staffed ships) while you're at it.
The Wall and infrastructure
A deal seems to be emerging, one that I advanced almost as a joke at faculty lunches. But it may happen. Give him his Wall, and get pretty much whatever you want in return.
From Trump's immigration offer
White House floated a proposal on Capitol Hill late Thursday that would offer legalization and a path to citizenship for some 800,000 so-called Dreamers in return for funding for President Trump’s wall at the Mexico-U.S. border and other changes to U.S. immigration law.And arguments for taking the offer. From William A. Galston (One of WSJ's liberals)
In all, only 37% of Americans think adding a substantially expanded wall on the southern border is a good idea. But we have reached a point at which the sentiments of the majority are politically secondary. It is unimaginable that Mr. Trump will break faith with his supporters on this matter. Any deal, broad or narrow, will have to acknowledge this reality.
My view on this:
Yes, the Wall is a bad idea on just about every policy-wonky (that's me) metric. What is it supposed to do? I guess, raise the wages of low-skilled american workers who compete with the kinds of immigrants who would cross a desert on foot illegally, and improve security, blocking the wave of Islamic terrorists who fly to Mexico, cross the border on foot, and stop to pick vegetables for a few years on the way to bombing things. If you're worried about security, we currently spend $13 billion per year on border patrol, and $6 billion on the entire FBI. Another $25 billion on the border does not seem the crying need. (Though the FBI does seem to have time on its hands lately.) On either grounds, the wall is a colossal cost-benefit waste.
But that is not the point. As Galston points out, the Wall is symbolic. President Trump campaigned on it, and wants very much to deliver some symbolic gesture to his supporters to say "I'm building the wall." Congressional democrats, centrist and never-Trump republicans can get pretty much whatever they want on policy if they will let the man have his symbolic victory.
So that is the question for our time: Can our politicians let the other side have a purely symbolic victory, in exchange for a large policy victory? Or is denying the President a symbolic victory so important that no quiet policy victory is worth the price?
My main new thought on this, which encourages me to agree with Galston -- take the deal -- is this: The Wall will never be built.
I live in California, in which our governor, 8 years of the Obama administration, and the democratic super-marjority in the state legislature, has been devoted to building a high speed train. To my mind, it is a boondoggle equal to the wall, but ignore that -- the entire political power structure in California and the Federal government has been behind this thing for 10 years. And yet not one mile of the line yet exists. It took the Union pacific 4 years to build the transcontinental railroad from Sacramento to Utah, over the Donner pass, by hand.
Such is infrastructure in the US today.
Can you imagine what will happen with the Wall, even if Congress appropriates $25 billion? It will instantly be in court. Start with environmental challenges. It will of course interrupt the migration path of the Eastern Arizona accelerati incredibilus. It will disrupt holy native lands and archeological sites. Mexicans are largely catholic, so suits will claim the wall is religious discrimination. Heck, infrastructure has to pass cost benefit tests, and good luck with that one. The contracting was improperly done. State attorney generals busy suing the Trump administration will quickly add to this one.
As with solar cells, as with the second avenue subway, as with the high speed train, as with the Keystone pipeline, good luck building any infrastructure in America today -- and especially good luck building one that makes little sense and is a highly politicized hot potato.
If they gave the President all he wanted, tomorrow, this thing would not be out of court for decades, long after a democratic congress or administration kills it.
They can afford to give him a symbolic victory. If, well, they decide that they can afford politically to give him a symbolic victory. For that is all it will ever be. And frankly, even $25 billion of waste to fix immigration would not be a bad tradeoff. The waste to our country in the current immigration system is on the back of my envelope orders of magnitude greater than that.
Looking forward to infrastructure.
As reported in the Wall Street Journal
U.S. Chamber of Commerce President Thomas Donohue last week was nearing the end of a speech urging Congress to rebuild the nation’s infrastructure when he offered another option: At least make it easier to build things when the money can be found.
“If we just fix the permitting thing this year, you would create an extraordinary enthusiasm about moving forward,” Mr. Donohue said,
...Mr. Trump and his aides have cited studies suggesting that environmental review can often take a decade,
A Government Accountability Office study of the environmental review process in 2014 cited third-party estimates that reviews average 4.6 years. Outside experts say actual review times vary widely based on the scope of a project and other environmental factors.If the average review time for, I guess, building a freeway cloverleaf, is 4.6 years, and often takes a decade, this makes my point -- don't worry about the wall!
The point of the article was that the Administration would like this to be reduced to two years. Good luck with that. The other point of the article is environmental groups lining up to fight any streamlining of the permitting process. Strategic delay rather than policy outcome is vital to them, apparently.
But the administration is right. If infrastructure is going to be built in the US, it strikes me that reforming the process for building infrastructure is the key. If home zoning and inspection requirements double the cost of residential solar cells, if prevailing wage, union work rules, and a hundred other impediments mean that subways cost billions of dollars per mile, many multiples of what they cost in France let alone China, and if permits take decades, and billions more of consultant and legal work, our problem with infrastructure is not finding the money to pay for it.
In the meantime, I offer a final suggestion to the Trump team: Offer to build a high speed train along the border instead! Just forget to put in any crossings.
(Update: I am just now reminded by a story on NPR that President Trump had, as a candidate, suggested coating the wall in solar cells. Truth is stranger than fiction.)
Neil Stewart at ESRI
Speaker: Professor Neil Stewart
Venue: ESRI, Whitaker Square, Sir John Rogerson’s Quay, Dublin 2
Registration: There is no fee to attend this event but please register your attendance HERE.
Seminar Topic
Professor Stewart will discuss three papers on behavioural science with mass transaction data.
Paper 1: Gathergood, J., Mahoney, N., Stewart, N., & Weber, J. (2017). How do individuals repay their debt? The balance-matching heuristic (available at SSRN: https://ssrn.com/abstract=3000526)
We study how individuals repay their debt using linked data on multiple credit cards from five major issuers. We find that individuals do not allocate repayments to the higher interest rate card, which would minimize the cost of borrowing. Instead, individuals allocate repayments using a balance-matching heuristic under which the share of repayments on each card is matched to the share of balances on each card. We show that balance matching captures more than half of the predictable variation in repayments, performs substantially better than other models, and is highly persistent within individuals over time. Consistent with these findings, we show that machine learning algorithms attribute the greatest variable importance to balances and the least variable importance to interest rates in predicting repayment behavior.
Paper 2: Quispe-Torreblanca, E., Stewart, N., Gathergood, J., & Loewenstein, G. (2017). The red, the black, and the plastic: Paying down credit card debt for hotels not sofas (available at SSRN: https://ssrn.com/abstract=3037416)
Using transaction data from a sample of 1.8 million credit card accounts, we provide the first field test of a major prediction of Prelec and Loewenstein’s (1998) theory of mental accounting. The prediction is that consumers will pay off expenditure on transient forms of consumption more quickly than expenditure on durables. According to the theory, this is because the pain of paying can be offset by the future anticipated pleasure of consumption only when money is spent on consumption that endures over time. Consistent with the prediction, we found that repayment of debt incurred for non-durable goods is an absolute 9% more likely than repayment of debt incurred for durable goods. The size of this effect is comparable to an increment in 15 percentage points in the credit card APR.
Paper 3: Sakaguchi, H., Stewart, N., & Walasek, L. (2017). Selling winners or losers: Two-stage decision making and the disposition effect in stock trading (available at SSRN: https://ssrn.com/abstract=3053331)
Current methods for estimating the disposition effect implicitly assume that all stocks are evaluated simultaneously in a single decision stage. Here we propose a two-stage model where investors first decide whether to sell a stock in the domain of gains or losses, and only then choose a stock to sell from within their chosen domain. As evidence, we show that the probability of individual gains being sold is inversely proportional to the number of gains in the portfolio, but is not associated with the number of losses. Similarly, the probability of individual losses being sold is inversely proportional to the number of losses in the portfolio, but is not associated with the number of gains. There are two consequences for the disposition effect: First, sell decisions are about the domain of gains versus losses, not just about individual stocks. Second, current regression methods must be refined to avoid substantial bias.
Speaker Bio
Professor Neil Stewart is the Professor of Behavioural Science at Warwick Business School in the University of Warwick. He works in the field of behavioural and economic science, and applies this research to problems in the real world. He is currently working on consumer decision making using credit card transaction data, on criminal and other bad behaviour using crime and incident records, and on a mathematical model of consumer decision making called decision by sampling. He uses a mixture of laboratory experiments, field experiments, and data science techniques applied to large data sets.
About the ESRI Seminar Series
The ESRI organises a public seminar series, inviting researchers from both the ESRI and other institutions to present new research on a variety of public policy issues. The seminar series provides access to specialised knowledge and new research methodologies, with the objective of promoting research excellence and facilitating productive dialogue across the policy and research fields.
Geary Institute and Amarach Research Event: Decisions and Well-Being in the Irish Population
Geary Institute and Amarach Research Event: Decisions and Well-Being in the Irish Population
Time: 1115am to 1pm.
Overview: We are delighted to invite you to a joint event being run by the Geary Institute for Public Policy and Amarach Research on well-being and decision making in Ireland. The use of well-being data in business and policy has attracted substantial international attention over the last decade but far more work is need to ground such data in practical applications in the Irish population. Similarly, the area of behavioural economics has become a major topic of interest, evidenced by the recent Nobel award. Yet the creation of data to develop applications of this area in Ireland is lacking so far. At the event, Professor Liam Delaney from UCD and Dr. Leonhard Lades EPA Research Fellow in Behavioural Economics will present findings on well-being and daily decision making in a representative sample of 1,000 people in the Irish population. The results display fascinating patterns of well-being and decision making across areas such as diet, work, social media, and many other areas of interest. It will be followed by a panel discussion addressing the potential uses of well-being and everyday diary decision data in Ireland. Some key topics include: how to use such data to evaluate well-being initiatives in workplace settings, how to measure the role of policy in shaping health and well-being in the population, how to evaluate the extent to which social media and smartphone use is contributing to positive and negative well-being and productivity outcomes. The event will be of interest to anyone involved in developing or consuming market research data and academics and professionals evaluating projects across a wide range of sectors.
Please register on this link. Registration is free but spaces are limited.
1115: Start
1115 - 1130: Overview: Liam Delaney (15 minutes)
1130 - 1200: Results: Leonhard Lades (30 minutes)
1200 - 1245: Discussion: Panel Chaired by Gerard O'Neill, Amarach Research
Right answer, wrong reason
Sometimes it is not good to get to the right answer for the wrong reasons. This thought comes to mind reading to recent WSJ articles, Walmart raises wages and Tax reform releases the bulls.
Economists see the world through incentives. In this narrative, a lower corporate tax rate increases the incentive to invest, broadly construed -- to buy new investment goods, sure, but also to invest in worker skills, organizational improvements, new opportunities, and for new companies to spring up. That investment raises the productivity of labor and hence demand for labor. Competing to hire good workers, companies drive up wages. But companies no more voluntarily give workers bonuses out of extra cash than they voluntarily send money to the electric company on top of the bill.
The Walmart headline falls distinctly into the first category. If so -- if this is how the corporate tax reduction raises wages -- an economist would say it's pretty fragile. Benevolence fades quickly.
Fortunately the rest of the article, if you read it with these views in mind, supports more the economists' view of what's really going on.
In the PR battle, it will likely be hard to admit that the kind of productivity raising investments the tax reform is supposed to induce can reduce demand for labor for each unit of output at individual companies. It will read like automation scare. Where overall demand for labor rises is that output rises and new companies come in to being.
Stocks.
We (readers of this blog) all understand that every cent of corporate taxes comes from higher prices, lower wages, or lower payments to shareholders. There is a bit of debate about which, and my previous reviews concluded that lower wages and higher prices were much more important than payments to shareholders.
Opponents of the tax cut claimed it would just be a windfall to profits, which would create a windfall to stock prices, which would benefit wealthy shareholders. This is the prime argument that the corporate tax cut benefited wealthy people. (Note, stockholders get no permanent rise in rate of return. They just get a one time windfall when the tax cut becomes reality.)
Again, cash flows vs. incentives; static vs. dynamic economies. If companies are just money machines, faxing fixed prices, wages, customers, and workers, and shareholders get to keep 80% rather than 65% of the money, then indeed the price should go up. But if companies respond to incentives, they invest, expanding capital, expanding output, and thereby quickly driving wages up, prices down, and profits back to normal. There should be a small bump in stock prices as these investments take time, but competition and entry drive profits back to normal quickly. (I'm describing the Q theory of investment with taxes here.)
As evidence, I pointed to the fact that stock prices seem to have very little historic correlation with corporate tax rates. That's good. It means that tax cuts are not just passed to shareholders, and do result in higher wages and lower prices. So if indeed this time the tax cut is just a boon to profits driving the stock market up, it will mean its antagonists were right, at least on the first of three links of their dubious chain to inequality.
I've done lots of work on P/E ratios, and I remain of the view that today's PE ratios reflect a low risk premium on top of a very low real interest rate. I also remain of the view that low risk premiums have nothing to do with central banks, QE, and the rest, but are perfectly normal in the eighth year of a very quiet expansion with very low volatility. Like all academics, I am fondly attached to my past papers, but habits does seem to do a pretty good job.
"Wal-Mart Stores Inc. said it would raise starting hourly pay to $11 for all its U.S. employees and distribute one-time bonuses, doling out some of the windfall it expects from the U.S. tax overhaul as it competes for store workers in a tight labor market."
"Only 15 market days have passed since the Senate passed the tax bill, ensuring it would become law, and Wall Street analysts have already upgraded their consensus forward earnings for the S&P 500 by an unprecedented 4.6%. Is it any wonder that stocks have rallied?"Two narratives compete for how corporate tax cuts might spur the economy: cashflows vs. incentives. Washington and most pundits like to talk about cashflows, "trickle-down" if you will. Corporations (existing, large) don't have to give so much money to the government. So perhaps they will benevolently pass it on to their workers -- or perhaps political pressure is important to force them to this magnanimity.
Economists see the world through incentives. In this narrative, a lower corporate tax rate increases the incentive to invest, broadly construed -- to buy new investment goods, sure, but also to invest in worker skills, organizational improvements, new opportunities, and for new companies to spring up. That investment raises the productivity of labor and hence demand for labor. Competing to hire good workers, companies drive up wages. But companies no more voluntarily give workers bonuses out of extra cash than they voluntarily send money to the electric company on top of the bill.
The Walmart headline falls distinctly into the first category. If so -- if this is how the corporate tax reduction raises wages -- an economist would say it's pretty fragile. Benevolence fades quickly.
Fortunately the rest of the article, if you read it with these views in mind, supports more the economists' view of what's really going on.
"On Thursday, the company also announced plans to cut roughly 10,000 jobs by closing about 10% of its 660 U.S. Sam’s Club warehouse stores....
Chief Executive Doug McMillon cited the tax overhaul for the pay increase, which the Trump administration praised at the White House."In our politicized economy, it is a good time to offer some worker-friendly PR! More deeply "investment" to "productivity" is the same thing as finding ways to do things with fewer, since competition means they must be higher-paid, workers.
"But the wage boost also comes as many U.S. businesses are contending with tight labor markets and rising wages. Retail rival Target Corp. recently lifted its starting pay to $11 an hour and Costco Wholesale Corp. starts hourly staff at $13."So, Walmart is just catching up to the competition, really.
The labor market is tight and getting tighter,” said Mark Zandi, ...
To combat wage pressures, Wal-Mart has tried to save on labor costs by adjusting the number of workers per store and more recently by automating many rote tasks. It is adding more self-service registers and using robots to scan shelves for items that are out of stock. Last year, Wal-Mart had around 15% fewer workers per square foot of store than a decade ago, according to an analysis by The Wall Street Journal.I.e. productivity-raising investments. Let us also remember that labor is not a spot market and keeping good workers is a good idea. It does make sense for wages to rise in advance of capital improvements if firms know they want to keep their good workers and know wages must rise in the future from competition.
In the PR battle, it will likely be hard to admit that the kind of productivity raising investments the tax reform is supposed to induce can reduce demand for labor for each unit of output at individual companies. It will read like automation scare. Where overall demand for labor rises is that output rises and new companies come in to being.
Stocks.
We (readers of this blog) all understand that every cent of corporate taxes comes from higher prices, lower wages, or lower payments to shareholders. There is a bit of debate about which, and my previous reviews concluded that lower wages and higher prices were much more important than payments to shareholders.
Opponents of the tax cut claimed it would just be a windfall to profits, which would create a windfall to stock prices, which would benefit wealthy shareholders. This is the prime argument that the corporate tax cut benefited wealthy people. (Note, stockholders get no permanent rise in rate of return. They just get a one time windfall when the tax cut becomes reality.)
Again, cash flows vs. incentives; static vs. dynamic economies. If companies are just money machines, faxing fixed prices, wages, customers, and workers, and shareholders get to keep 80% rather than 65% of the money, then indeed the price should go up. But if companies respond to incentives, they invest, expanding capital, expanding output, and thereby quickly driving wages up, prices down, and profits back to normal. There should be a small bump in stock prices as these investments take time, but competition and entry drive profits back to normal quickly. (I'm describing the Q theory of investment with taxes here.)
As evidence, I pointed to the fact that stock prices seem to have very little historic correlation with corporate tax rates. That's good. It means that tax cuts are not just passed to shareholders, and do result in higher wages and lower prices. So if indeed this time the tax cut is just a boon to profits driving the stock market up, it will mean its antagonists were right, at least on the first of three links of their dubious chain to inequality.
I've done lots of work on P/E ratios, and I remain of the view that today's PE ratios reflect a low risk premium on top of a very low real interest rate. I also remain of the view that low risk premiums have nothing to do with central banks, QE, and the rest, but are perfectly normal in the eighth year of a very quiet expansion with very low volatility. Like all academics, I am fondly attached to my past papers, but habits does seem to do a pretty good job.

